Relief Visualization Toolbox (RVT)
Project Team
Žiga Kokalj, PhD, assoc. prof. , Klemen Zakšek, PhD, Peter Pehani, Klemen Čotar, Maja Somrak, Nejc Čož, PhD-
Duration
2 September 2013 -
Project Leader
-
Financial Source
Slovenian Research Agency
European Commission's Culture programme
The Relief Visualization Toolbox (RVT) transformed how lidar-derived terrain data are used in archaeology and environmental analysis. By introducing accessible and scientifically validated visualisation methods, RVT made advanced terrain interpretation part of everyday professional practice in heritage management, research, education, and commercial spatial analysis. Available as standalone software, Python tools, ArcGIS functions, and a QGIS plugin, RVT is now used internationally by heritage agencies, researchers, consultancies, and community projects, with more than 100,000 downloads and adoption in official standards and training programmes.
It was developed to help scientist visualise raster elevation model datasets. We narrowed down the selection to include techniques that have proven to be effective for identification of small scale features. Default settings therefore assume working with high resolution digital elevation models, derived from airborne laser scanning missions (lidar).
Despite this, techniques are also used for different other purposes. Sky-view factor, for example, can be efficiently used in numerous studies where digital elevation model visualisations and automatic feature extraction techniques are indispensable, e.g. in geography, geomorphology, cartography, hydrology, glaciology, forestry and disaster management. It can be used even in engineering applications, such as, predicting the availability of the GPS signal in urban areas.
Methods currently implemented are:
- Visualisation for Archaeological Topography (VAT)
- Hillshading
- Hillshading from multiple directions
- Slope
- Simple local relief model
- Sky-view factor
- Anisotropic sky-view factor
- Openness
- Prismatic openness
- Local dominance
- Sky illumination
- Multi-scale relief model (MSRM)
- Multi-scale topographic position (MSTP)
- Enhanced multi-scale topographic position (eMSTP)
For a more detailed description see references given at each method in the manual and a comparative paper describing them (e.g. Kokalj and Hesse 2017, see below).
RVT supports elevation raster file data conversion. It is possible to convert all frequently used single band raster formats into GeoTIFF, ASCII gridded XYZ, Erdas Imagine file and ENVI file formats. Mosaicking of multiple files, e.g. tiled lidar elevation models, works well if data are reasonable, i.e. if all the files have the same projection, resolution, square pixels etc.
Development of RVT was part financed by the European Commission's Culture Programme through the ArchaeoLandscapes Europe project and by the Slovenian Research Agency core funding No. P2-0406, and by research projects No. J6-7085 and No. J6-9395.
A bug: PCA does not work with large files.
Downloads
Relief Visualization Toolbox Standalone version (EXE), Windows 64-bit, version 2.2.1
Relief Visualization Toolbox manual, version 2.2.1 (Instructions for use).
Documentation for RVT in Python, QGIS and ArcGIS raster functions.
GitHub
RVT standalone (IDL)
RVT Python functions (rvt_py)
RVT ArcGIS raster functions
RVT QGIS plugin
Please report any bugs and suggestions for improvements.
References
When using the tools, please cite:
- Kokalj, Žiga, 2025. Standardizing visualization in ancient Maya lidar research: techniques, challenges and recommendations. Archaeological prospection.
- Zakšek, K., Oštir, K., Kokalj, Ž. 2011. Sky-View Factor as a Relief Visualization Technique. Remote Sensing 3(2): 398-415 .
Further reading
- Kokalj, Ž., Somrak, M. 2019. Why Not a Single Image? Combining Visualizations to Facilitate Fieldwork and On-Screen Mapping. Remote Sensing 11(7): 747.
- Kokalj, Žiga, Ralf Hesse. 2017. Airborne laser scanning raster data visualization: A Guide to Good Practice. Ljubljana: Založba ZRC.
Images
Note: click to enlarge, press ESC to quit.
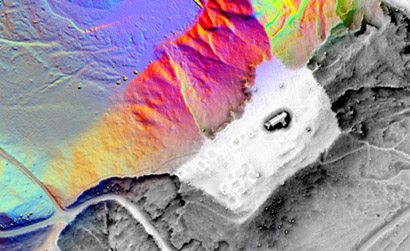
 | Visualization techniques showing St. Helena church and its immediate surroundings. St. Helena is a known yet un-researched archaeological site west of Kobarid, Slovenia, believed to be a late Roman camp. |
 | Relief Visualization Toolbox graphical user interface for choosing different visualizations and their options. |
 | Relief Visualization Toolbox graphical user interface for conversion of raster elevation files. The tool reads all tipically used raster formats and converts them into GeoTIFF, ASCII gridded XYZ, Erdas Imagine file and ENVI file formats. |
 | RVT supports five different blend modes, which can be used to improve the visibility (recognition) of small topographical features. Selected visualizations are are blended (combined, fused) in a consecutive order from bottom to top. |
 | Visualization for archaeological topography calculated combines hillshading (or hillshading from three directions), slope, positive openness and sky-view factor with predetermined calculation and blending settings for ‘normal’ (complex) and very flat terrain. We have selected the visualization methods based on their complementary positive characteristics and the specific blending modes because they amplify these particular characteristics. |